
When there is a need for quick and comprehensive financial data in R, quantmod comes to rescue. It was originally envisioned as a rapid prototyping environment to facilitate quantitative modeling, testing, and trading. Quantmod allows R to read data from CSV files, spreadsheets, databases, datasets of statistical packages, and from the web (Google, Yahoo, FRED, and others).
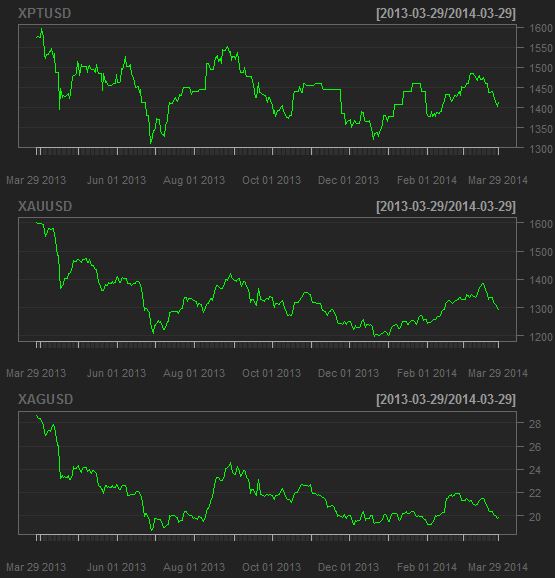
Here is a quick look on how precious metals performed in one year.
> library(quantmod)
 > getMetals(c('XPT', 'XAU','XAG'), from=Sys.Date()-365)
 > layout(matrix(1:3, nrow=3))
 > chartSeries(XPTUSD, layout=NULL, TA=NULL)
 > chartSeries(XAUUSD, layout=NULL, TA=NULL)
 > chartSeries(XAGUSD, layout=NULL, TA=NULL)
 > layout(1)
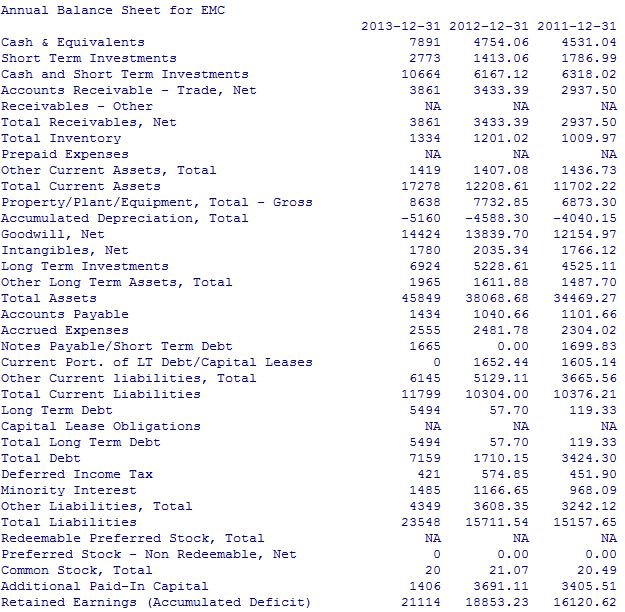
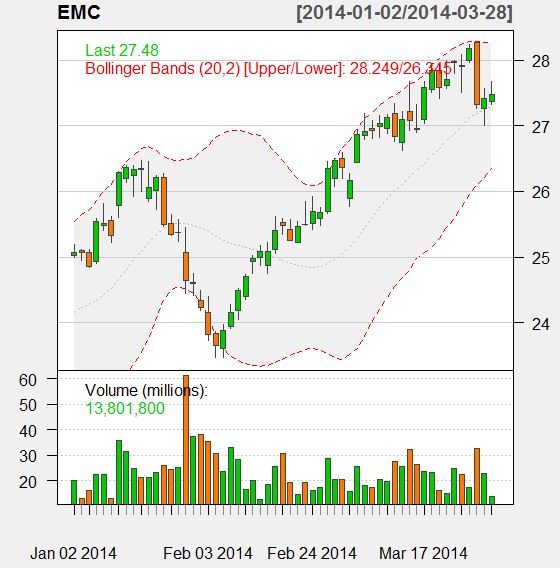
Analyzing financial results and stock quotes of EMC –
 > getFinancials("EMC")
 > viewFinancials(EMC.f)
 > getSymbols("EMC")
 > chartSeries(EMC)
 > addBBands()
 > reChart(subset="2014", theme="white", type="candles")
 |
 |
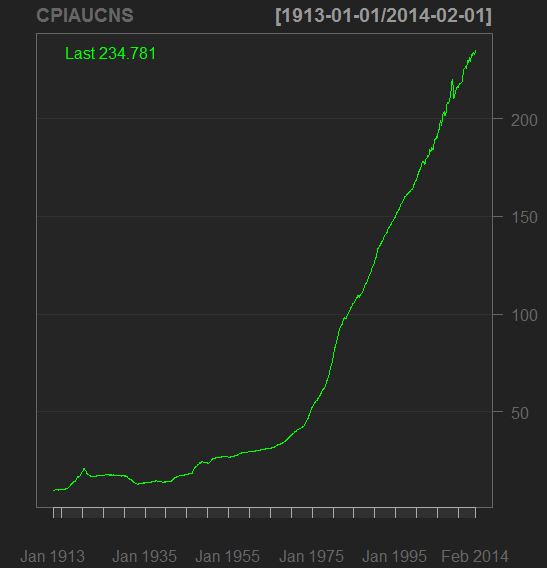
Quick look at FRED (Federal Reserve Economic Data from Federal Reserve Bank of St. Louis) on Consumer Price Index –
 |
 |

