After finding related facts between Jay and me that goes back to ancient times, I moved to learn geocoding and maps visualization in R. Here is how I learnt –
Started with loading needed libraries:
> library(ggplot2)
> library(maps)
> library(scales)
> library(ggmap)
Get the geocode of the related cities:
> geocode("Bangalore")
lon     lat
1 77.59456 12.9716
> geocode("Philadelphia")
lon     lat
1 -75.16379 39.95233
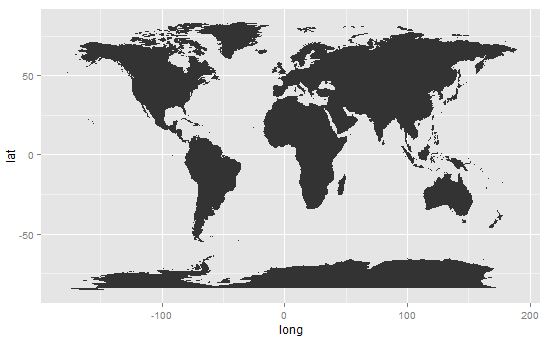
Plot the map of the world:
> ds <- map_data("world")
> class(ds)
[1] "data.frame"
> str(ds)
'data.frame':  25553 obs. of 6 variables:
$ long     : num -133 -132 -132 -132 -130 ...
$ lat     : num 58.4 57.2 57 56.7 56.1 ...
$ group   : num 1 1 1 1 1 1 1 1 1 1 ...
$ order   : int 1 2 3 4 5 6 7 8 9 10 ...
$ region   : chr "Canada" "Canada" "Canada" "Canada" ...
$ subregion: chr NA NA NA NA ...
> head(ds)
long     lat group order region subregion
1 -133.3664 58.42416     1     1 Canada     <NA>
2 -132.2681 57.16308     1     2 Canada     <NA>
3 -132.0498 56.98610     1     3 Canada     <NA>
4 -131.8797 56.74001     1     4 Canada     <NA>
5 -130.2492 56.09945     1     5 Canada     <NA>
6 -130.0131 55.91169     1     6 Canada     <NA>
> p <- ggplot(ds, aes(x=long, y=lat, group=group))
> p <- p + geom_polygon()
> p

World
Plot the national boundaries:
> p <- ggplot(ds, aes(x=long, y=lat, group=group, fill=region))
> p <- p + geom_polygon()
> p <- p + theme(legend.position = "none")
> p
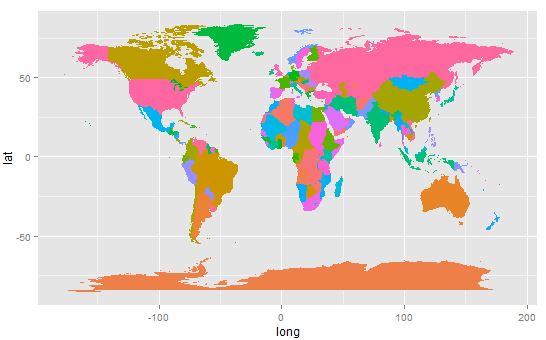
Countries
Bring USA into focus:
> map <- get_map(location = as.numeric(geocode("USA")), zoom=4, source="google")
> p <- ggmap(map)
> p
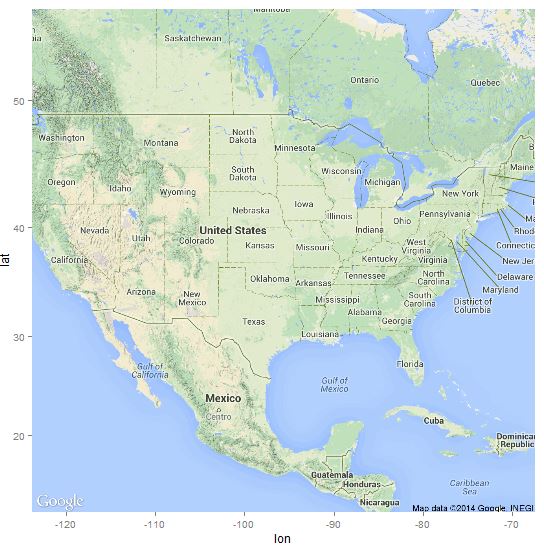
USA
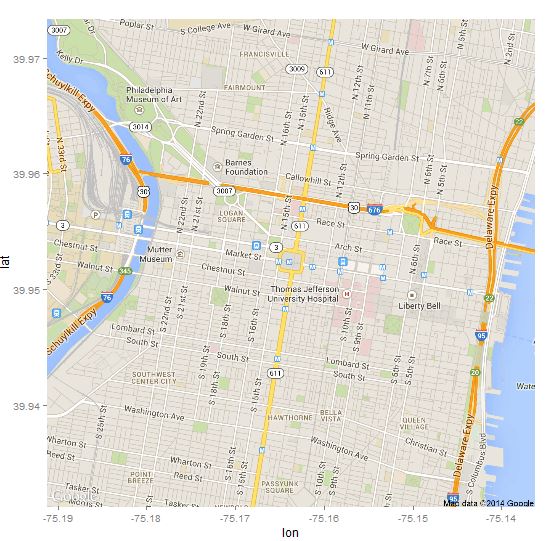
Highlight Philadelphia, PA:
> map <- get_map(location="Philadelphia, PA", zoom=14, maptype="roadmap", source="google")
> p <- ggmap(map)
> p

Philly
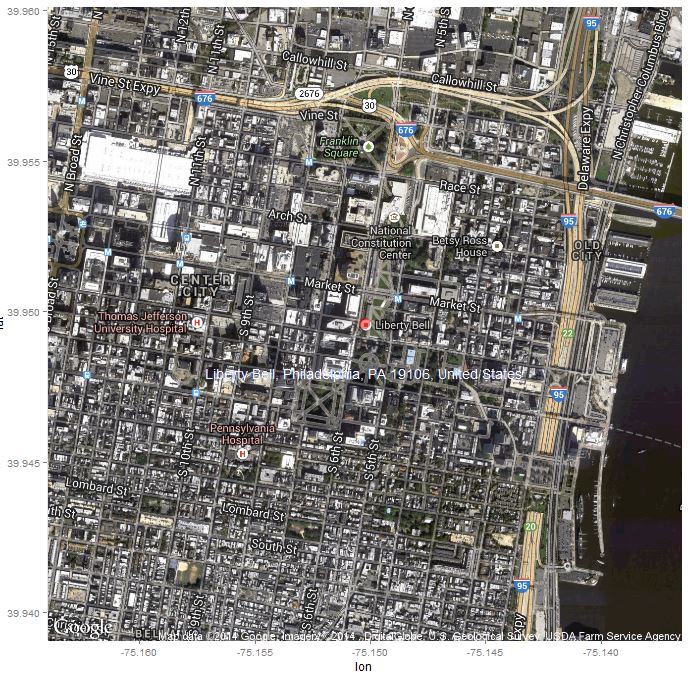
Voila, the reception venue :)
> addr <- "Liberty Bell, Philadelphia, PA 19106, United States"
> loc <- as.numeric(geocode(addr))
> lbl <- data.frame(lon=loc[1], lat=loc[2], text=addr)
> map <- get_map(location=loc, zoom=15, maptype="hybrid", source="google")
> p <- ggmap(map)
> p <- p + geom_point(data=lbl, aes(x=lon, y=lat), alpha=I(0.5), size=I(5), color="red")
> p <- p + geom_text(data=lbl, aes(x=lon, y=lat, label=text), size=5, color="blue", hjust=0.5, vjust=5)
> p

Liberty Bell Center
Can’t wait to set the date… :)